The GMP Lottery: Full IPO Allotment Is the Market’s Politest Warning
Grey-market premiums manufacture urgency; lock-up calendars manufacture supply. Compute your all-in IPO CAGR before the next queue.
 January 23, 2026by cyborg.vaibhav@gmail.com8 min read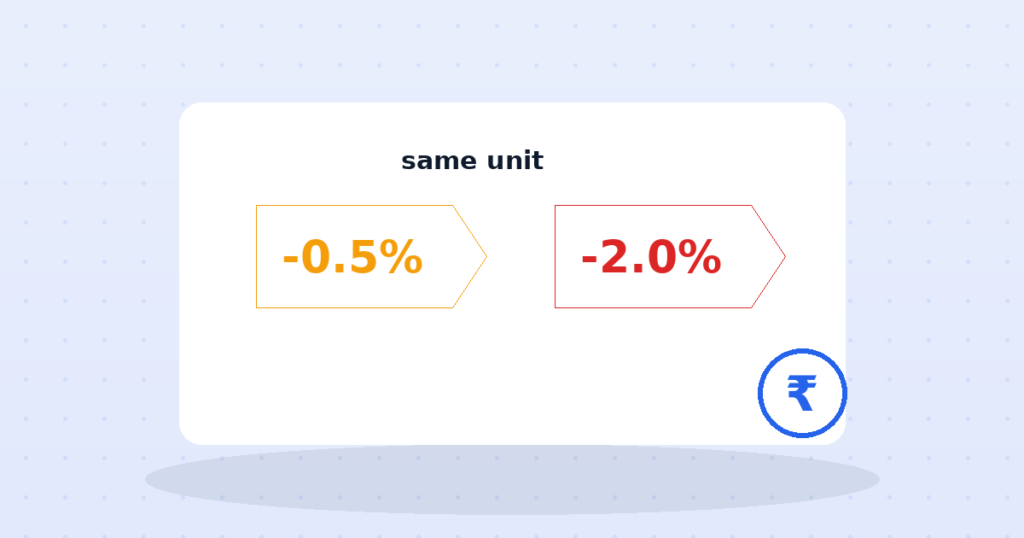
On a red Friday, Nifty was down 2%. Deepak Chandran, who manages a retail clothing store in Kozhikode (a composite drawn from ETF investors like him, not a real individual), opened his app to check the damage to his NiftyBees — down only 0.5%. For a warm minute he felt clever, like his ETF had a seatbelt. Then he sold some units, and the seatbelt revealed what it actually was: he had sold at a price that did not exist. An ETF has two prices — the real one and the one on your screen — and the distance between them belongs to whoever knows it is there.
An ETF’s true worth is its NAV — the live value of the fifty stocks inside it. But units trade on the exchange like any stock, at whatever the last buyer and seller agreed. In a calm market, professional arbitrageurs — Authorised Participants — keep the two glued together, because any gap is free money to them. In a panicked market, the glue is optional. If bids are thin and sellers are desperate, the screen price can float far from the NAV — showing “−0.5%” while the truth is −2%.
Here is the part almost every ETF explainer skips, and it is the actual answer to “why does the price usually track NAV so closely anyway?” SEBI’s framework for mutual funds permits large investors and market makers — the Authorised Participants — to deal directly with the fund itself, not just on the exchange. They can hand over a basket of the underlying shares (or cash) and receive a “creation unit” of new ETF units in bulk, or do the reverse and redeem units for the basket. That direct channel is what makes arbitrage possible at all: if the exchange price drifts even slightly above NAV, an AP buys the underlying basket, converts it into ETF units through creation, and sells those units on the exchange at the inflated price, pocketing the difference and pushing the price back down. Below NAV, the trade runs in reverse. It is a self-correcting mechanism, but only for those with access to the creation-unit window — which is not Deepak, and is not almost any retail investor.
SEBI’s own mutual fund disclosure framework requires every ETF to publish an indicative NAV (iNAV) through the exchange during trading hours, refreshed within a short lag — on the order of fifteen seconds — specifically so that a retail investor has a running fair-value reference to check the screen price against before placing an order. The iNAV exists precisely because the regulator recognised that price and NAV can and do diverge, and gave retail investors a public number to catch it. Almost nobody looks at it.
Here is the uncomfortable part: the APs have no obligation to close the gap instantly. They close it when it is profitable and convenient. During a crash, a market maker can let bids sit shallow, buy panic-sold units below fair value, and create or redeem later at NAV — pocketing the spread that a retail seller donated by trusting the screen. Around dividend record dates the confusion deepens, and in low-volume ETFs the “price” can be little more than a suggestion. None of this is illegal. All of it is priced into your exit.
Sell ₹5 lakh of units 1.5% below fair value and you have donated ₹7,500 for the convenience of panicking at market price. Do that a few times across a decade of rebalancing, and the drag quietly rewrites your CAGR — the metric you chose ETFs to protect.
Every AMC publishes a live indicative NAV (iNAV) for its ETFs, and your terminal shows the ETF’s market price. Before any order: compare the two. Within about 0.3%? Trade. Wider? Use a limit order pegged near iNAV, or simply wait — gaps close when panic does. And never place a market order in an ETF during a crash or in the first and last fifteen minutes of the session, when spreads are widest.
CAGR (Compound Annual Growth Rate) is the single steady annual rate that would take your starting value to your ending value over this period — useful for comparing two investments fairly even if their paths were bumpy along the way. It ignores any money added or withdrawn in between; if you invested in instalments, a SIP-style calculator is a better fit than CAGR.
Tax: the post-tax CAGR card assumes listed equity/equity funds held over a year — 12.5% LTCG on the gain beyond ₹1.25L (per financial year), no indexation. If this were a debt fund or FD, the whole gain is instead taxed at your slab rate, which drags the post-tax CAGR further — at a 30% slab, a headline 8% pre-tax CAGR is really about 5.6% post-tax. Always compare investments on post-tax CAGR, not the brochure number.
The calculator settles a question most ETF holders never think to ask: not “did the market do well”, but “did I personally capture what the market did, or did I hand a slice of it to whoever was on the other side of my market order”. For an SIP-style ETF investor who rarely trades, the gap between the two numbers should be near zero. If it isn’t, the order type is the first place to look, not the fund.
Prefer high-volume ETFs where competition keeps spreads honest. Make limit orders a habit, not an exception. If you never need intraday exits, consider index funds instead — you always transact at NAV, no spread games possible, in exchange for end-of-day pricing. The ETF’s superpower is tradability; make sure you are using it, not paying for everyone else’s.
It does not mean ETFs are a scam, or that Authorised Participants are doing anything improper. The creation-redemption mechanism is exactly what SEBI’s framework intends, and most of the time it does its job well enough that the price-NAV gap stays too small to matter for a buy-and-hold investor. It also does not mean every ETF trade needs a limit order and an iNAV check — a monthly SIP into a high-volume, large-cap ETF during normal market hours rarely sees a meaningful gap.
What it does mean is narrower: the protection that arbitrage provides is a background process, not a personal guarantee, and it is weakest exactly when you are most likely to want to trade — during a panic, in a thinly traded ETF, near the market open or close. Deepak’s mistake was not owning an ETF. It was trusting a number on a screen at the one moment that number was least trustworthy.
His units were always worth NAV — down 2% like the market. The −0.5% was the screen flattering him. The moment he sold into it, he converted a cosmetic gap into a real loss for himself and a real profit for the buyer.
For a monthly SIP investor who never trades intraday — largely yes. The ETF’s edge (live trading, slightly lower expense) only pays if you trade carefully, with limit orders and an iNAV check.
No — creation units are large blocks, typically worth crores of rupees, meant for Authorised Participants and large institutional investors. A retail investor’s only door into the ETF is the exchange screen, which is exactly why checking iNAV before trading matters more for retail investors, not less.
Regulatory source: SEBI (sebi.gov.in) sets out the creation/redemption mechanism for Authorised Participants and the indicative NAV disclosure requirement for exchange-traded schemes in its Master Circular for Mutual Funds. The framing of the two-door analogy, the arithmetic on Deepak’s slippage and the “whose gap is it anyway” comparison are this article’s own.
Disclaimer: This article is for general information only and is not financial or tax advice. “Deepak Chandran” is a composite character representing a typical retail ETF investor, not a real individual. Consult a qualified advisor before making investment or tax decisions.
Grey-market premiums manufacture urgency; lock-up calendars manufacture supply. Compute your all-in IPO CAGR before the next queue.
For two decades funds compared dividend-inclusive returns against a dividend-free index. SEBI ended it in 2018; the folklore…
Underperform long enough and the scheme vanishes into a sibling with better numbers. Your own CAGR is the…
Returns over several years can mislead. CAGR shows the smooth annual rate your investment actually grew at.
Agricultural income is exempt, but partial integration uses it to pick a higher rate for your salary. The…
Deferring tax is an interest-free loan from the government. Growth vs IDCW, employer NPS, gain harvesting, CGAS, section…