Rent in the City, Buy Farmland, Pay No Tax: The Advice That Raises Your Tax Bill
Agricultural income is exempt, but partial integration uses it to pick a higher rate for your salary. The…
 February 11, 2026by cyborg.vaibhav@gmail.com7 min read
Tanvi Deshpande’s trading app celebrated her birthday. It celebrates everything: her first trade (confetti), her login streak (badge), a stock she looked at once (three notifications by lunch). Tanvi, 27, a UX designer in Pune, knows exactly why the app is built this way — she designs interfaces like it for a living. Her portfolio is down 11% this year, but her engagement is excellent. Somewhere in a dashboard, that is the number that matters — because the app is not in the investing business. It is in the transaction business, and Tanvi is the transaction.
A broker earns nothing when you hold a good portfolio for a decade. It earns on every order, every F&O leg, every margin rupee lent. So the entire interface is tuned for motion: live P&L blinking in red and green, price alerts you never asked for, “top movers” lists engineered to trigger FOMO, one-tap options trading placed closer to your thumb than your SIP. None of this is remotely accidental. Product teams A/B test these screens against a metric — orders per user — and ship whatever raises it. The casino does not need to rig the wheel; it just needs you to keep spinning.
Every needless trade pays brokerage, STT, GST, stamp duty, exchange charges and — the big one — the bid-ask spread and bad timing that activity invites. Cost a modest 2% a year of drag from all of it: on ₹5 lakh over 10 years, the difference between 12% and 10% is about ₹2.56 lakh — a quarter of the starting capital, donated to friction, one confetti burst at a time.
SEBI’s own study of individual equity F&O traders across FY22-FY24 found that 93% lost money, with average losses near ₹2 lakh per trader over the period and the worst-affected 3.5% — roughly 4 lakh people — losing an average of about ₹28 lakh each. The detail that matters most for an app-design conversation is what happened next: more than 75% of the traders who lost money in one year kept trading F&O in the following year anyway. That persistence is not irrational stubbornness — it is exactly the outcome a well-designed, highly engaging interface is built to produce. A screen that makes losing feel like “almost winning” is doing its job when the user places one more trade to fix it.
Tanvi recognises the pattern from her own work: a near-miss animation, a streak counter that resets and re-baits itself, a red number that flashes just long enough to feel personal rather than statistical. None of these are unique to trading apps — they are the same behavioural-design toolkit used in mobile games and social feeds, applied to something that happens to hold a person’s actual savings. The difference is stakes. A missed streak on a game costs nothing. A missed streak on a trading app, chased with one more F&O position to “get back to even,” is how a ₹2 lakh loss becomes an ₹28 lakh one for the unluckiest 3.5%.
Open your app and count the taps to place an intraday options order versus the taps to view your ten-year return. The interface’s priorities are its owner’s priorities, written in buttons. SEBI’s F&O study — 93% of individual traders losing money, and most of them coming back for more — is the outcome of those buttons, measured at national scale.
YOU ENTER how much you’d invest and for how long instead of trading it; IT TELLS YOU what the same money becomes if it is left alone to compound rather than churned through fees, spreads and bad timing. What the calculator settles is the actual size of the gap between the boring, closed-app version of Tanvi’s portfolio and the one she is living with today.
Both paths run to the same end date — the delayed start simply invests for fewer years. The gap isn't the skipped instalments (those are small); it's the compounding those instalments never get to do. SEBI's investor site has a version of this calculator; this one adds what it leaves out: the delayed investor would need a visibly larger SIP to catch up, shown in the banner.
Tax: both corpuses are shown pre-tax and are taxed identically on redemption (equity funds: 12.5% LTCG beyond ₹1.25L of gains a financial year), so tax doesn't change the comparison — but note the delayed corpus has a *higher share of principal*, so the gap after tax is slightly smaller than the headline. The lesson survives any tax regime: time in the market is the one input you can't buy back.
Make the app boring on purpose: turn off every non-essential notification, remove watchlist widgets from your home screen, and log in on a schedule — monthly is plenty for an investor. Automate the SIP so investing continues when attention doesn’t. Keep long-term holdings at a different broker from any trading experiments, so temptation needs a password. If you do trade F&O, set a hard personal rule before a losing streak, not during one — SEBI’s own numbers show that “one more trade to recover it” is the single most common decision after a loss, and it is usually the wrong one. Your portfolio’s best feature is a closed app; compounding is famously, reliably allergic to attention.
None of this means every trader loses or that F&O has no legitimate use — hedging and genuine price discovery are real functions the segment serves, and a minority of disciplined, well-capitalised traders do profit consistently. It also doesn’t mean every notification or gamified feature is malicious; some genuinely help investors stay informed, and a well-timed alert about an actual portfolio event is different from a manufactured one designed purely to bring you back into the app. The point is narrower: the interface’s incentives and your financial goals are usually not the same incentive, and knowing which parts of the design serve which side is worth doing before, not after, a losing year.
It also does not mean Tanvi should feel foolish. She is, by her own profession, more aware of persuasive design than almost anyone using the app — and she still found herself checking it multiple times a day. That is not a personal failing; it is evidence of how well the underlying design works on exactly the kind of attentive, informed user it is built to capture. The fix was never going to be willpower. It was turning off the mechanisms that make willpower necessary in the first place.
Zero brokerage on delivery is real, but the business model then monetises your activity elsewhere: F&O, margin funding, float, and paid data or advisory add-ons. “Free” is the price of your attention, and attention is where returns quietly leak away.
Monthly glance, annual rebalance, decadal patience. Anything more frequent serves the app’s metrics, not yours, and rarely changes what a disciplined investor should actually do that day.
SEBI’s own data shows over three-quarters of loss-making F&O traders return to trade again the following year. A design built around engagement metrics tends to frame a loss as a near-miss rather than a result, which nudges toward one more attempt rather than a stop, and the same streaks and badges that reward good habits elsewhere in the app quietly reward the wrong habit here.
Disclaimer: Tanvi Deshpande is a composite character based on common trading-app usage patterns, not a real person. This article is for general information only and is not financial or tax advice. Consult a qualified advisor before making investment or tax decisions.
Agricultural income is exempt, but partial integration uses it to pick a higher rate for your salary. The…
Deferring tax is an interest-free loan from the government. Growth vs IDCW, employer NPS, gain harvesting, CGAS, section…
EPF and NPS both carry real equity exposure, while EPF-VPF tax thresholds are twice as generous for government…
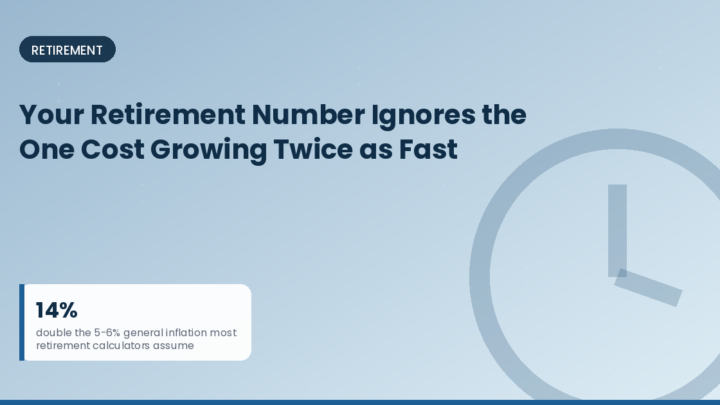
Medical inflation runs 10-14% a year in India, nearly double the 5-6% general inflation most retirement calculators assume.
India has 967 SEBI-registered fiduciary advisers against over 1,33,000 commission-paid distributors.
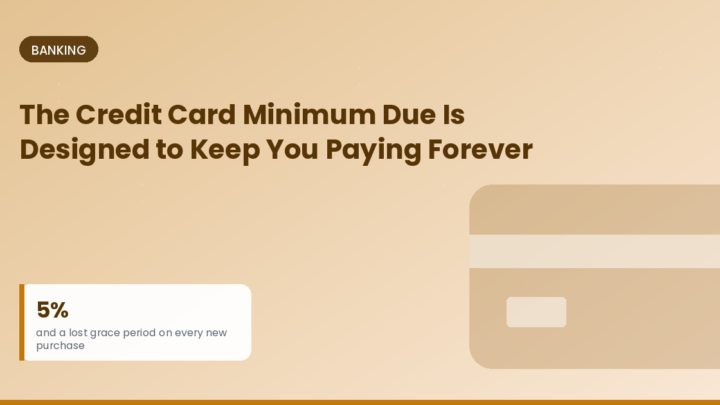
5% minimum due, 36-42% annual interest, and a lost grace period on every new purchase.