Closet Indexing: Active Fees for an Index Fund in a Trench Coat
Your large-cap fund hugs Nifty at nine times the fee. The costume costs Rs 10 lakh on a…
 February 9, 2026by cyborg.vaibhav@gmail.com7 min read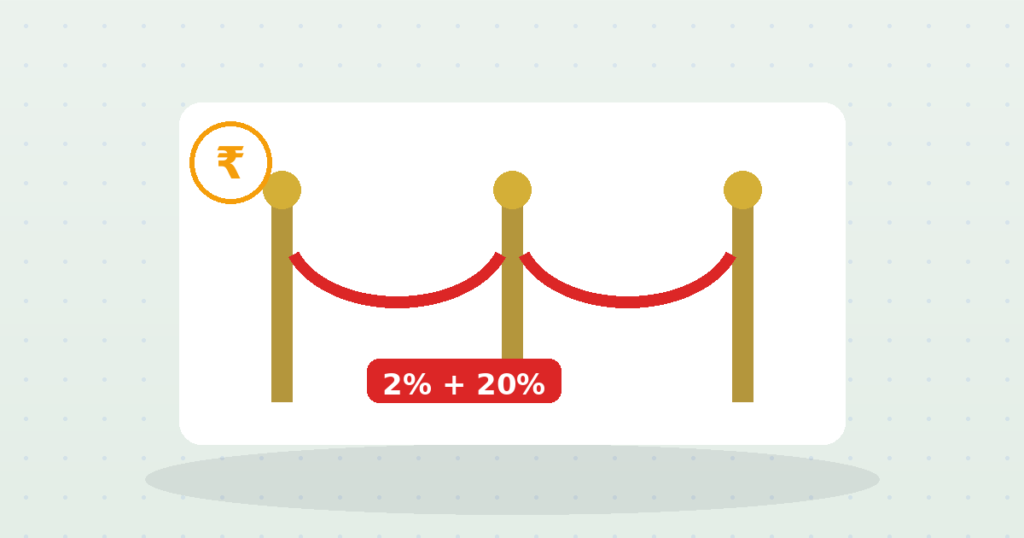
The invitation was flattering: a “by-invitation” PMS presentation in a hotel with better coffee than Arjun Mehta’s bank branch. Arjun, 47, runs a components-export business out of Coimbatore. Minimum ticket ₹50 lakh. “Beyond mutual funds,” the deck said. “Bespoke.” What the deck rendered in the smallest font was the price of bespoke: 2% of his money every year, plus 20% of profits above a hurdle. Arjun was being congratulated into a fee structure. Wealth, it turns out, mostly buys you more sophisticated ways to underperform — and, as it happens, a genuinely useful government-mandated report that almost nobody in that hotel room ever asks to see.
Portfolio Management Services and AIFs sell exclusivity as a proxy for returns. But the arithmetic is indifferent to marble lobbies: a 2% fixed fee plus 20% profit share means that in a year the market returns 12%, a PMS must generate roughly 15% just for you to match an index fund — every single year, after taxes that PMS structures often make worse (each portfolio trade is a taxable event in your own account, unlike a mutual fund’s internal churns). The manager’s incentive under a profit share is to swing hard: heads he shares your win, tails you keep the whole loss.
₹50 lakh over 10 years at an honest index-fund 11.8% net becomes about ₹1.53 crore. The same money netting 9.6% after PMS-style fees becomes about ₹1.25 crore — a ₹27.5 lakh entrance fee for the club, paid regardless of whether the “bespoke” strategy ever beat the boring one it was sold against.
The 2% fixed fee is charged on the full corpus regardless of performance, which means it compounds against Arjun in flat and down years exactly as hard as in good ones — a mutual fund’s expense ratio is smaller and still does this, but a PMS layers a 20% profit share on top in the good years, so the manager captures upside asymmetrically while Arjun alone absorbs the downside. Over a decade of ordinary market cycles, with a few flat years mixed among the strong ones, the fixed fee alone can quietly consume a meaningful share of what would otherwise have been index-level growth, before the profit share even enters the picture.
PMS return disclosures used to be genuinely unstandardised: model-portfolio returns, cherry-picked periods, and survivor-only composites were endemic. SEBI addressed this directly — since April 1, 2023, every registered portfolio manager must report performance using a standardised time-weighted rate of return (TWRR), categorise its strategy into one of a small set of defined categories, and benchmark against one of a limited set of indices prescribed through the Association of Portfolio Managers in India (APMI), with monthly reports filed to both APMI and SEBI. This is the single most useful document Arjun could ask for in that hotel room, and almost nobody does — the marketing deck’s own hand-picked chart is what gets shown instead, even though a standardised, regulator-visible number now exists specifically to replace it.
YOU ENTER your ticket size and an assumed fee drag; IT TELLS YOU exactly what that structure costs in rupees over your own horizon, compared against a plain index route with no hurdle and no profit share. What the calculator settles is whether the exclusivity is buying you anything beyond a bigger bill.
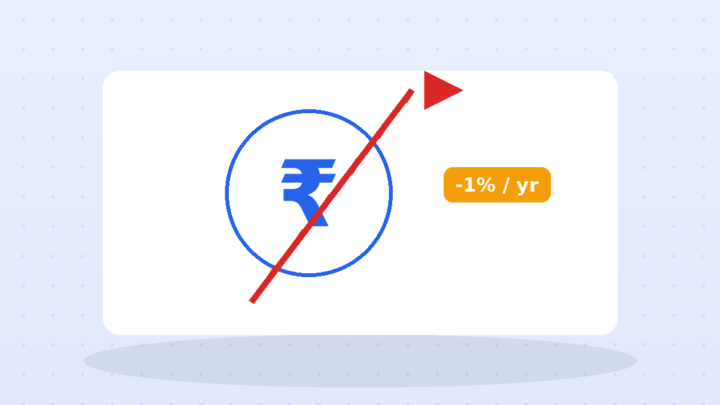
The drag compounds just like returns do — a 1% annual difference barely shows in year one and quietly becomes lakhs over decades. The most common real-world 1% in India: the expense-ratio gap between a regular mutual-fund plan (bought through a distributor) and the direct plan of the exact same fund, which typically runs 0.5-1.5% a year. Same fund, same manager, same portfolio — different take-home.
Tax angle: fees hurt twice — the drag reduces your gains, but LTCG tax (12.5% on equity gains beyond ₹1.25L/yr) is charged on what's left, so the government shares your gains while the fee is yours alone. And unlike tax, the fee applies to your whole balance every year, gains or not. Checking a fund's expense ratio takes 10 seconds on the factsheet; this calculator shows what those 10 seconds are worth.
Arjun signed based on the deck’s chart, which showed three years of strong numbers against a benchmark the PMS itself had chosen. Had he instead requested the standardised APMI-filed TWRR report before committing, he would have seen the same manager’s performance measured the same way every other registered PMS is measured — a comparison the marketing chart was never designed to survive. Ten years later, the gap between what the deck implied and what the standardised number actually shows is the entire ₹27.5 lakh fee drag, compounding quietly the whole time, entirely invisible on any single year’s statement in isolation.
This is the pattern that makes the standardised report worth the awkwardness of requesting it. A single glossy chart is designed to be persuasive in one sitting; a monthly, regulator-filed TWRR history covering multiple market cycles is designed to survive scrutiny across years, which is exactly why almost nobody selling a PMS product volunteers it unprompted.
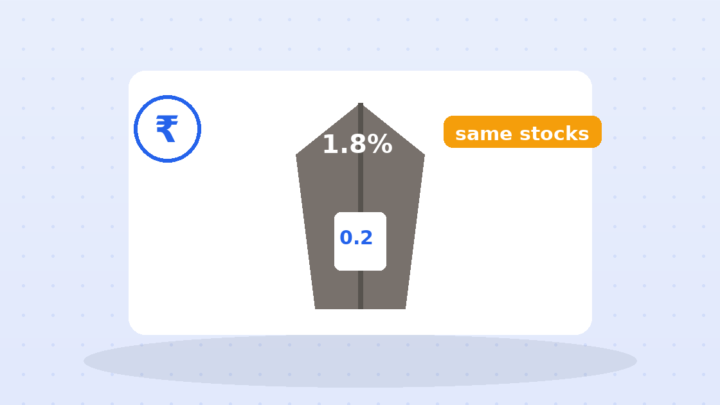
Treat every exclusive product as a fee schedule until proven otherwise. Demand the standardised, APMI-filed TWRR performance report and category benchmark — not the manager’s own deck — for the full 7–10 years the strategy has existed; the request alone filters most of the room. Remember that at ₹50 lakh you also qualify for something genuinely exclusive: direct index funds at 0.2% with no hurdle, no lock-in and no coffee. And run the fee drag above with your own actual ticket size; marble is genuinely expensive once it compounds.
None of this means every PMS or AIF is a bad product, or that SEBI’s standardisation rule makes every manager equally worth their fee. A small number of disciplined, capacity-limited strategies genuinely do earn their fees over full cycles, and the TWRR standard exists precisely to help identify which ones, rather than to declare the entire category worthless. The point is narrower: asking for the standardised number costs nothing and removes the marketing deck’s ability to choose its own comparison.
It also doesn’t mean exclusivity itself is meaningless. A genuinely differentiated, capacity-constrained strategy that only accepts a limited number of large investors can have real reasons for its minimum ticket beyond marketing — concentrated positions that would move markets if scaled to retail size, for instance. The test is not whether a product is exclusive; it is whether the exclusivity is accompanied by a standardised, verifiable performance record an investor can actually check, rather than a story told once, in a room with good coffee, and never revisited against the regulator’s own numbers.
A few genuinely do, for stretches — concentrated, capacity-limited strategies run by unusually disciplined managers. The problem is identifying them reliably in advance, which is the same lottery as picking star mutual funds, only played with a much higher entry fee attached.
Same test, with more layers added: setup fees, distribution commissions and genuine illiquidity. Complexity in a financial product is usually not sophisticated engineering; it is simply packaging built around the fee.
Yes — it applies to every single SEBI-registered portfolio manager, requiring standardised performance reporting and category-appropriate benchmarking filed monthly with both APMI and SEBI since April 1, 2023.
Disclaimer: Arjun Mehta is a composite character based on common high-net-worth product-pitch patterns, not a real person. This article is for general information only and is not financial or tax advice. Consult a qualified advisor before making investment or tax decisions.
Your large-cap fund hugs Nifty at nine times the fee. The costume costs Rs 10 lakh on a…
One form filled in 2016 still earns him a raise every year. See the Rs 12.5 lakh the…
Agricultural income is exempt, but partial integration uses it to pick a higher rate for your salary. The…
Deferring tax is an interest-free loan from the government. Growth vs IDCW, employer NPS, gain harvesting, CGAS, section…
EPF and NPS both carry real equity exposure, while EPF-VPF tax thresholds are twice as generous for government…
Medical inflation runs 10-14% a year in India, nearly double the 5-6% general inflation most retirement calculators assume.