The Refinance Treadmill: Lower Payment, Longer Sentence
Each refi resets the interest-heavy years and rolls in fresh costs. Keep the rate; keep the clock honest.
 March 5, 2026by cyborg.vaibhav@gmail.com3 min read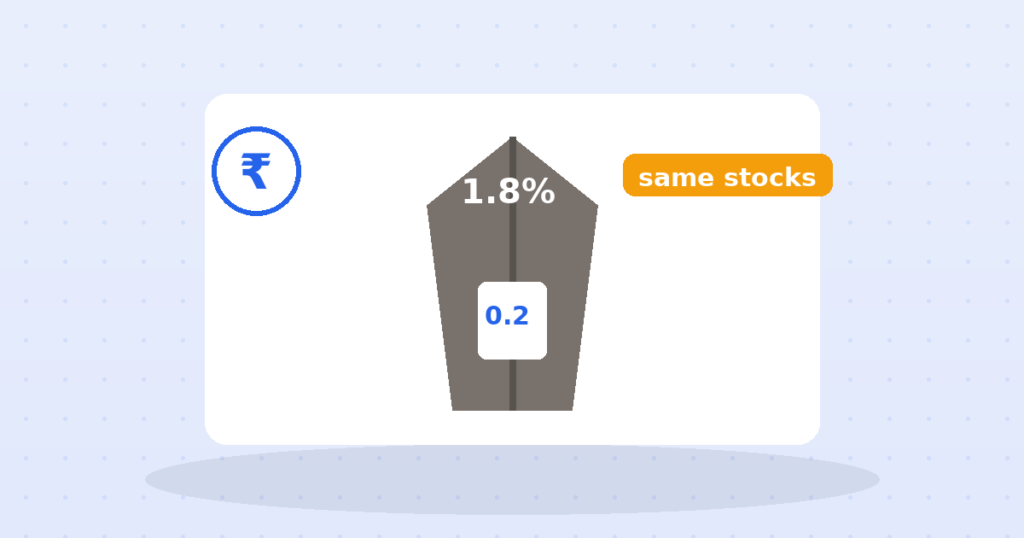
Mohan pays his large-cap fund 1.8% a year for “active management”. The fund’s top ten holdings are Nifty’s top ten, in almost Nifty’s exact weights. Its returns hug the index like a shadow, minus fees. There is a name for this in the industry — closet indexing — and the closet is where the fee schedule hides. Mohan owns an index fund wearing a trench coat, and he is paying nine times the fare for the costume.
A large-cap fund manager’s career risk is not underperformance — it is underperformance that looks different from everyone else’s. Deviate boldly and fail, you are fired; hug the index and trail it by your fee, you are “consistent”. So portfolios converge on the benchmark, while marketing continues selling stock-picking skill. In a market where SEBI’s categorisation rules already force large-cap funds to fish in the same 100 stocks, the active large-cap fee is mostly a toll on inertia.
The index fund charges ~0.2%; the trench coat charges ~1.8%. On ₹10 lakh over 15 years — 11.8% net versus 10.2% net — the gap is ₹10.4 lakh: your original investment, again, paid for the privilege of owning the same fifty companies with extra paperwork.
Three tells, all public: the top-ten holdings overlap almost fully with the index; the fund’s month-to-month returns track the benchmark within a whisker; and the factsheet’s “active share” (where disclosed) is low. If a fund moves like the index, charge yourself the honest question: what exactly is the 1.6% extra buying?
The drag compounds just like returns do — a 1% annual difference barely shows in year one and quietly becomes lakhs over decades. The most common real-world 1% in India: the expense-ratio gap between a regular mutual-fund plan (bought through a distributor) and the direct plan of the exact same fund, which typically runs 0.5-1.5% a year. Same fund, same manager, same portfolio — different take-home.
Tax angle: fees hurt twice — the drag reduces your gains, but LTCG tax (12.5% on equity gains beyond ₹1.25L/yr) is charged on what's left, so the government shares your gains while the fee is yours alone. And unlike tax, the fee applies to your whole balance every year, gains or not. Checking a fund's expense ratio takes 10 seconds on the factsheet; this calculator shows what those 10 seconds are worth.
For large-cap exposure, default to an index fund or ETF and let the burden of proof sit on any active fund asking 5–9× the fee. Where active management has genuinely more room — small caps, special situations — judge managers over full cycles, not star ratings. And run your own funds through the calculator above: 1% sounds abstract until it prints in rupees against your name.
Some do, every year — rarely the same ones twice. You are not choosing last year’s winner; you are choosing the fee you will definitely pay while hoping to guess next year’s.
No — genuine high-conviction investing exists and occasionally earns its fee. The con is charging active fees for passive behaviour. The portfolio, not the pitch, tells you which one you own.
Disclaimer: This article is for general information only and is not financial or tax advice. Consult a qualified advisor before making investment or tax decisions.
Each refi resets the interest-heavy years and rolls in fresh costs. Keep the rate; keep the clock honest.
Fear sells early claiming — a permanent 30% cut to dodge a hypothetical 20% one. Run the break-even…
The default fund stacks a wrapper fee on underlying fees — $118,000 over a career for a rebalancing…